![]()
![]()
![]()
![]()
![]()
![]()
![]()
![]()
REVESCO. Revista de Estudios Cooperativos. ARTÍCULOS
e-ISSN: 1985-8031
Manuel M. Molina-López
Universidad
San Pablo CEU, CEU Universities (España) ![]()
![]()
Encina Morales de Vega
Universidad
San Pablo CEU, CEU Universities (España) ![]()
![]()
Susana González-Pérez
Universidad
San Pablo CEU, CEU Universities (España) ![]()
![]()
Ricardo J. Palomo Zurdo
Universidad
San Pablo CEU, CEU Universities (España) ![]()
![]()
https://dx.doi.org/10.5209/REVE.106336 Recibido: 28/07/2025 • Aceptado: 24/11/2025 • Publicado: 26/02/2026
ES Resumen. Este artículo aborda la influencia del género en el rendimiento financiero de las startups digitales desde una perspectiva social, destacando disparidades y oportunidades en este sector. A través del análisis de datos de la base de datos Sistema de Análisis y Balances Ibéricos (SABI), se evalúan indicadores clave como el tamaño de la empresa, la rentabilidad, el apalancamiento y la eficiencia, utilizando técnicas de Propensity Score Matching (PSM) para una comparación justa entre empresas lideradas por hombres y mujeres. El estudio revela desafíos significativos para las empresarias, especialmente en términos del tamaño inicial de la empresa y el acceso a financiamiento. A pesar de estos obstáculos, se observa que las startups lideradas por mujeres muestran un sólido rendimiento financiero, enfatizando la importancia de un enfoque controlado para el tamaño de la empresa y otros factores. El artículo destaca que el acceso equitativo a la financiación es crucial para el desarrollo y la competitividad de las mujeres en el ámbito empresarial. Más allá de los aspectos financieros, este artículo se centra en la necesidad de políticas y apoyos financieros que aborden la brecha de género en el emprendimiento digital, resaltando el papel vital de la economía social en la promoción de la igualdad de género. Argumenta a favor de un mejor acceso al crédito y fomenta un ecosistema de apoyo que no solo mejore el éxito de los negocios liderados por mujeres, sino que también contribuya a un entorno emprendedor más inclusivo y equitativo. Este enfoque refuerza la importancia de la economía, desde su perspectiva social, en la creación de un terreno de juego nivelado para todos los emprendedores, independientemente de su género.
Palabras clave. Startups digitales, rendimiento financiero, emprendimiento femenino, Propensity Score Matching, economía social y digital, educación emprendedora.
Claves Econlit. M130, M140, M200, M210.
ENG Gender equality in digital entrepreneurship: a social and educational perspective
ENG Abstract. This article addresses the influence of gender on the financial performance of digital startups from a social perspective, highlighting disparities and opportunities in this sector. Through the analysis of data from the Sistema de Análisis y Balances Ibéricos (SABI) database, key indicators such as company size, profitability, leverage, and efficiency are evaluated, employing Propensity Score Matching (PSM) techniques for a fair comparison between male and female-led enterprises. The study reveals significant challenges for female entrepreneurs, especially in terms of initial company size and access to financing. Despite these obstacles, it is observed that startups led by women exhibit robust financial performance, emphasizing the importance of an approach controlled for company size and other factors. The article underscores that equitable access to financing is crucial for the development and competitiveness of women in the business arena. Beyond financial aspects, this article focuses on the need for policies and financial supports that address the gender gap in digital entrepreneurship, highlighting the vital role of the social economy in promoting gender equality. It argues for improved access to credit and fostering a supportive ecosystem that not only enhances the success of women-led businesses but also contributes to a more inclusive and equitable entrepreneurial environment. This approach reinforces the importance of the economy, from its social and educational perspective, in creating a level playing field for all entrepreneurs, regardless of gender.
Keywords. Digital startups, financial performance, female entrepreneurship, Propensity Score Matching, social and digital economy, education entrepreneurship.
Summary. 1. Introduction. 2. Theoretical framework. 3. Description of sample and methodology. 4. Analysis and results. 5. Conclusions and discussion. 6. References.
How to cite: Molina-López, M.M.; Morales de Vega, E.; González-Pérez, S. & Palomo Zurdo, R.J. (2026). Gender equality in digital entrepreneurship: a social and educational perspective. REVESCO. Revista de Estudios Cooperativos, 152, e106336. https://dx.doi.org/10.5209/REVE.106336.
The growing visibility of female entrepreneurship contrasts with the persistent gender gap in the digital economy. Despite progress in regulatory frameworks and public policies promoting gender equality, women still face structural barriers in accessing entrepreneurial opportunities, especially in technology-based sectors (Agrawal et al., 2023; González-Pérez et al., 2025; Molina-López et al., 2021). The role of women in entrepreneurship has gained increasing attention not only due to their contributions to economic and social development, but also because of their alignment with the United Nations Sustainable Development Goals (OEE, 2021).
In the Spanish context, digital entrepreneurship has become a strategic axis for economic transformation. As of 2022, over 3.3 million active companies operate in Spain, with 95.78% being microenterprises (DIRCE, 2023). These companies generate 38% of employment and contribute 28% of GDP (ONTIS, 2023). Spain ranks seventh in the European Union’s Digital Economy and Society Index (DESI), and eleventh in the digital integration of businesses. Indicators such as the percentage of SMEs with basic digital intensity or environmental ICT use exceed the European average (Comisión Europea, 2023). Public strategies such as “España Digital 2025” and the “SME Digitalisation Plan 2020–2025” allocate 23% of Recovery Plan funds to digital transformation, particularly benefiting microenterprises and self-employed workers (Gobierno de España, 2023). Part of this investment can potentially support sectors where the social economy is more prominent, such as agriculture, contributing to territorial cohesion, environmental sustainability, and job creation (Del Cerro et al., 2023; Palomo and Isabel, 2022).
However, the gender gap persists. It is observed that 90% of innovative startups seeking venture capital are founded by men, while women-led startups receive 23% less funding and present lower success expectations (OECD, 2018). Policy initiatives such as ENISA loans, the Women’s Talent Attraction Programme (EOI), and NEOTEC programmes aim to mitigate these inequalities.
In this context, this study focuses on female entrepreneurship in digital enterprises, particularly new technology-based firms (NEBTs), defined as small, recently created, independent companies that operate in high-tech sectors (Storey and Tether, 1998; Almus and Nerlinger, 1999). These companies are characterised by short life cycles, high growth potential, and the use of emerging technologies (Motohashi, 2005). It is observed that digital entrepreneurship has a strong projection capacity, even in small labour structures, and offers self-employment and microenterprises a strategic pathway to economic participation and job creation (Martínez, Guilló and Santero, 2019). This gives rise to what may be considered a digital social economy, where entrepreneurship is not only a business endeavour but also a vector of inclusion and innovation, particularly in platform-based models that seek to democratize technological governance and algorithmic control (Alquézar Crusellas, 2025; Sánchez Espada J., et. al, 2018).
Therefore, the focus on female digital entrepreneurship is justified for two reasons. Firstly, it is a sector with significant economic and social potential. Secondly, as a traditionally male-dominated field, understanding the gender-based dynamics is essential. The objective of this article is to analyse the economic and financial performance of female-led digital startups in Spain, using a matched sample methodology (Propensity Score Matching) to evaluate whether their results differ significantly from male-led firms. In addition to financial indicators, the analysis incorporates a social and educational lens, considering the implications of these inequalities for policy-making and gender-inclusive entrepreneurship promotion.
Results reveal structural barriers that hinder the growth and competitiveness of female-led ventures, particularly in their initial stages. However, the analysis shows that when firms are evaluated under comparable conditions, women-led startups achieve profitability and operational efficiency levels equivalent to those of their male-led counterparts.
2.1. Entrepreneurship and performance
The analysis of gender in entrepreneurship performance has generated two opposing perspectives in the literature. On one hand, a body of research has suggested that female entrepreneurs tend to achieve lower economic outcomes compared to their male counterparts, with differences in sales, profitability, and employment creation (Du Rietz and Henrekson, 2000; Fairlie and Robb, 2007; Klapper and Parker, 2010; Brixiová and Kangoye, 2016; Shinnar et al., 2018). It is observed that factors such as limited access to credit, reduced initial capital, and lower levels of previous experience and education contribute to these discrepancies (Kalleberg and Leicht, 1991; Rosa et al., 1996; Robb and Wolken, 2002). In this sense, Fairlie and Robb (2007), based on a sample of U.S. companies, point out that women-led businesses are smaller, more vulnerable to closure, and less profitable. These outcomes are explained by structural conditions that disadvantage women in the entrepreneurial process, reinforcing the notion of underperformance.
Moreover, Mazrekaj (2024) states that women are less likely than men to engage in high-growth businesses and entrepreneurial activities, primarily because of lower self-perceived entrepreneurial abilities and differing motivations shaped by cultural and societal norms. Women’s self-perceptions about their skills and risk-taking capacities tend to be lower (Kariv et al., 2023; Molina-López et al. 2024), influenced by longstanding gender stereotypes that question female competence in business, which discourages them from pursuing aggressive growth ventures. In this sense, Jennings et al. (2022) find, by analyzing the Global Entrepreneurship Monitor (GEM) 2020, that women are just as likely as men to have accurate self-assessments of their entrepreneurial abilities, while men are more prone to overconfidence. This overconfidence can lead to riskier and potentially detrimental business decisions. Furthermore, Milanov et al. (2025) analyze why highly qualified women with high entrepreneurial self-efficacy (ESE), prestigious education, and access to Silicon Valley entrepreneurial networks often do not choose tech venture founding as their primary career path, because if their personal goals or culturally assumed gender roles do not align with what they believe entrepreneurship entails, their interest in starting a business may diminish, or they may seek alternative ways to engage.
On the other hand, other studies question this hypothesis. It is observed that when controlling for variables such as company size, sector, or capital intensity, female-owned businesses do not necessarily show lower performance (Justo et al., 2015; Aidis and Weeks, 2016; Farhat and Mijid, 2016). Robb and Watson (2012), for instance, argue that the evaluation of business success should adjust for structural factors, as traditional financial indicators may not capture the full complexity of women’s entrepreneurial strategies. Moreover, Farhat and Mijid (2016) demonstrate that business survival, profitability, and growth are not significantly different between male and female entrepreneurs when observed under matched conditions. Demartini (2018) also highlights that differences in performance can be attributed to divergent motivations, risk attitudes, and goals rather than to lower entrepreneurial capacity among women. Recent contributions have also emphasized how gender diversity in governance structures can positively influence business performance, even in traditionally male-dominated industries such as insurance (Morales de Vega et al., 2025).
From a critical perspective, feminist approaches have introduced conceptual frameworks that deconstruct the notion of underperformance. Ahl (2006) and Ahl and Marlow (2012) argue that mainstream entrepreneurship research often adopts a gender-neutral perspective that overlooks the structural constraints affecting women. These studies call for a redefinition of entrepreneurial success that goes beyond economic outcomes, incorporating social value creation, resilience, and innovation. In this line, Aidis and Weeks (2016) propose the concept of high-impact female entrepreneurship, focusing on market-expanding and export-oriented women-led ventures. Measurement tools such as the Gender-Global Entrepreneurship and Development Index (GEDI, 2018) reflect this broader approach to evaluating entrepreneurial ecosystems from a gender-sensitive perspective.
Finally, it is observed that women may voluntarily exit ventures not due to failure but because of personal or professional choice (Justo et al., 2015). This nuance challenges assumptions around performance and opens the debate on how gender, context, and institutional frameworks interact to shape entrepreneurial trajectories.
2.2. Female digital entrepreneurship
Female digital entrepreneurship is an emerging and rapidly evolving field within the broader digital entrepreneurship literature (Dana et al., 2024). Although this research topic has garnered increasing attention, it remains at a nascent stage, characterized by fragmented contributions and a lack of solid theoretical foundations (Alhajri & Aloud, 2023; Paul et al., 2023). Research highlights the empowering role of digital technologies in reducing gender gaps in entrepreneurship by enhancing women's access to investment decision-making, education, and health resources (Miniesy et al., 2022; Shukla et al., 2021). However, empirical studies suggest that women entrepreneurs often face underperformance in high-tech digital environments, underscoring the need for experience-based research to better understand the challenges they encounter (Kang, 2022; Jawad et al., 2021).
In this regard, adopting a comprehensive approach that analyzes the digital entrepreneurial ecosystem, encompassing key elements such as social norms, government policies, human capital, financial capital, infrastructure, and the digital economy, is essential to understanding the complex and multifaceted causal mechanisms influencing female entrepreneurial activity (Huang et al., 2025). Prior research demonstrates that no single element within this ecosystem is sufficient or necessary alone to achieve high levels of female entrepreneurial participation; rather, it is the interaction and configuration of these factors that drive outcomes (Hechavarría and Ingram, 2019). Social norms emerge as particularly critical because they exert a broad and profound influence not only directly on women’s entrepreneurial intentions and cognitions, byshaping perceptions about gender roles and entrepreneurial self-efficacy, but also indirectly by strengthening the effects of other ecosystem components such as government policies and human capital development (Grootaert & Van Bastelaer, 2002; Huang et al., 2022). For instance, strong societal support and positive social recognition can compensate for weaknesses in other areas, such as limited financial resources or suboptimal market conditions, by fostering entrepreneurial confidence and motivation among women (Huang et al., 2025).
Furthermore, the integration of digital economy elements, such as digital infrastructure, platforms, and e-commerce channels, into the entrepreneurial ecosystem creates new opportunities for women by lowering traditional barriers related to financing, market access, and networking, thus expanding their market reach and innovative capacities (Nambisan, 2017; Elia et al., 2020; Alhajri & Aloud, 2024). However, the degree of digital accessibility and usability of technological environments remains a critical factor in ensuring inclusive participation (Fernández Torres et al., 2025) A digital entrepreneurial ecosystem perspective, particularly one that accounts for the interplay between normative, institutional, human, and technological factors, offers a nuanced and holistic understanding of the conditions that facilitate or constrain female entrepreneurial dynamism in the digital economy (Hechavarría & Ingram, 2019; Yang et al., 2024).
The reality shows that women’s participation in digital entrepreneurship remains markedly low despite recent advances. It is observed that, although the gender gap in early-stage entrepreneurship has been narrowing since 2012 (OEE, 2021), women still face significant limitations in consolidating sustainable and innovative business projects, particularly in digital sectors. According to the GEM report (2022), 6.5% of women in Spain are engaged in consolidated entrepreneurship, compared to 7.5% of men.
Sociodemographic and structural characteristics define this gap. Female-led initiatives tend to concentrate in consumer and business services, with only a marginal presence in manufacturing and extractive industries. Most women entrepreneurs lead microenterprises, with 45% of initiatives lacking employees and only 2% having more than 20 employees. The technological level of women-led businesses is also low: 95% are non-innovative and operate with basic technological inputs (GEM, 2022; OEE, 2021).
In terms of financing, women entrepreneurs mobilize 11% less capital than men on average, with a higher dependence on personal savings and family contributions. Only 14.9% of their financing comes from financial institutions, and 1.2% from crowdfunding, limiting their growth capacity and access to scale economies.
At the European level, women account for just 5.7% of entrepreneurs—well below the global average of 11%—and are significantly underrepresented in patent authorship (Naldi et al., 2005). However, it is observed that women in Europe participate more actively in ICT entrepreneurship than in other regions, with increasing involvement in sectors such as fintech, healthtech, legaltech, and digital education (GERA, 2021; Tejeiro Koller et al., 2021).
In Spain, the “solopreneur” model has emerged, particularly in digital ventures, where individual women entrepreneurs create and manage their startups without founding teams (South Summit & IE University, 2022). Regional studies reinforce the gender imbalance: in the Community of Madrid, only 16% of tech entrepreneurs are women (Morales-Alonso et al., 2016), indicating persistent exclusion from high-impact innovation ecosystems.
Despite this, it is observed that the areas with the highest number of women digital entrepreneurs include digital education and social-purpose ventures, reflecting an alternative pattern of innovation oriented toward social needs (Tejeiro Koller et al., 2021). This suggests that promoting digital entrepreneurship among women requires more than financing: it demands structural changes in education, support networks, and public policy. This perspective is consistent with recent systematic evidence on student entrepreneurship in higher education, which highlights the decisive role of universities in shaping entrepreneurial intention, sustainability orientation, and social value creation (Hernández Muñoz et al., 2025).
In this regard, early interventions that foster leadership capacity and entrepreneurial attitudes in girls and young women are crucial. It has been demonstrated that educational programmes based on authentic leadership models can enhance self-perception, agency, and ambition among adolescent girls, strengthening their potential to overcome gendered barriers in future professional contexts (Molina-López et al., 2024; Rubio-Andrés et al., 2023). These approaches align with a broader strategy that integrates gender equality, education, and digital innovation as mutually reinforcing dimensions.
This study adopts a quantitative approach based on the analysis of financial and economic variables of digital startups in Spain, with a specific focus on gender-based differences in entrepreneurial outcomes. The analysis is supported by data extracted from the Sistema de Análisis y Balances Ibéricos (SABI) database and employs Propensity Score Matching (PSM) techniques to ensure comparability between female- and male-led firms.
The first phase of the research consisted of a large-scale data extraction process using the following criteria: companies established from 1 January 2010 onwards, with at least five years of available fiscal data (not necessarily consecutive), legally active, and domiciled in Spain. In order to identify potentially digital companies, the selection was limited to firms operating within the CNAE codes used by Zubillaga and Peletier (2018), consistent with the classification criteria for technology-based companies employed by Demartini (2018).
The initial search yielded approximately 309,000 companies. A random 1% sample (3,013 companies) was selected and subjected to manual verification to confirm their digital nature, based on website content, social media presence, and core business activities. Once validated, companies were classified by the predominant gender composition of their boards of directors. This process resulted in a final sample of 1,802 male-led and 130 female-led digital companies.
The second phase of the study involved a descriptive analysis of the financial performance of female-led startups across five key dimensions: volume (assets, revenue, employees), profitability (ROA, ROE), financial structure (debt and equity), leverage, and operational efficiency. This analysis was conducted over a five-year time horizon, starting from the year of company creation.
To ensure fair comparison and to control for selection bias, a matching process was applied using the PSM technique. This method estimates the probability of a company being female-led based on observable characteristics (company size, year of foundation, sector of activity, and location), allowing for the construction of a control group of male-led firms with similar profiles. The matching was conducted using two methods: nearest neighbour matching and kernel matching.
The subsequent comparative analysis between male- and female-led firms focused on key financial indicators: return on assets (ROA), return on equity (ROE), debt ratio, equity levels, financial leverage, revenue per employee, solvency, effective interest rates, and interest-to-income ratios. Differences in mean values were tested using t-tests for statistical significance.
This methodological design makes it possible to isolate the effect of gender on entrepreneurial outcomes, controlling for structural variables, and to assess whether performance disparities are attributable to gender-based discrimination or other firm-level characteristics.
4.1. Descriptive analysis of female-led digital startups
We have a sample of 130 female digital companies, of which 26% are based in Barcelona and 30% are located in Madrid. More than half of these companies were founded after 2015, with the oldest companies established in 2008. First, the average evolutionary behaviour of the entire group of companies in terms of the number of employees, assets, and revenue is characterised.
Table 1 illustrates the dynamics across different groups of variables (volume, profitability, financial structure, financial management, and financial efficiency) of the studied female digital companies. A general upward trend in the volume of the companies is evident in terms of assets and revenue, starting from the year of creation (year 0) with respective averages of 70,000 euros and 41,000 euros, reaching mean values of 320,000 euros and 285,000 euros in year 5. The number of employees, with an average of just over one employee in the founding year, evolves to mean values exceeding 3 employees, stabilising somewhat in the later years. Focusing on financial efficiency, as shown in Table 2, there is an increase in equity and, more steadily, in income per employee, with a significant rise in the former in the last period. The average profitability of the companies in the sample, as measured by the mean values of ROA and ROE, grows in the initial years and then declines to initial values in year 3, with a sharp rise in ROE in the latter periods.
The indebtedness of the female companies decreases in the first year to below 46% and then generally shows an increasing trend to values exceeding 54%. Notably, there is a mean decrease in year 4. Regarding financial leverage (Graph 6), the mean value in the first year is close to zero, increasing in the following two years to peak at a mean value greater than 0.6, and then decreasing to initial values in the final period.
On average, over the study period, the companies have between 2 and 3 employees, assets exceeding 212,000 euros, and revenue of 183,000 euros. In terms of profitability, the values of ROE and ROA are observed to be 9% and -4.8%, respectively. Additionally, the companies show an average indebtedness just over 50%, with logarithmic-scale equity of 3.7 and leverage of 0.3. Concerning financial efficiency, the average solvency value for the period is 0.6, with income per employee amounting to 66,000, an average effective interest rate of 2.6%, and an interest payment-to-income value of 0.014.
Table 1. Temporal evolution of the main analysed variables
|
|
Year 0 |
Year 1 |
Year 2 |
Year 3 |
Year 4 |
Year 5 |
Average |
|
Volume |
|||||||
|
Employees |
1.1 |
1.9 |
2.5 |
3.2 |
3.4 |
3.3 |
2.6 |
|
Assets (‘000 EUR) |
70.9 |
155.1 |
198.4 |
252.5 |
275.4 |
320.4 |
212.1 |
|
Revenue (‘000 EUR) |
41.7 |
128.2 |
177.0 |
217.6 |
247.8 |
285.1 |
182.9 |
|
Profitability |
|
|
|
|
|
|
|
|
ROE |
-3.2 |
15.8 |
11.6 |
-0.2 |
11.3 |
18.8 |
9.0 |
|
ROA |
-8.1 |
-3.6 |
-2.6 |
-6.8 |
-1.3 |
-6.5 |
-4.8 |
|
Financial Structure |
|
|
|
|
|
|
|
|
Debt ratio (%) |
48.8 |
45.7 |
50.2 |
53.6 |
49.1 |
54.5 |
50.3 |
|
Equity (logarithm) |
2.5 |
3.4 |
3.9 |
3.8 |
4.0 |
4.6 |
3.7 |
|
Financial leverage |
0.0 |
0.5 |
0.6 |
0.2 |
0.2 |
0.1 |
0.3 |
|
Financial Management and Operational Efficiency |
|
|
|
|
|
|
|
|
Solvency (logarithm) |
0.8 |
0.8 |
0.5 |
0.6 |
0.4 |
0.8 |
0.6 |
|
Revenue per employee |
36.2 |
64.6 |
71.7 |
67.6 |
72.4 |
84.2 |
66.1 |
|
Effective interest (%) |
0.3 |
8.1 |
0.7 |
0.9 |
2.9 |
2.8 |
2.6 |
|
Interest to revenue |
0.012 |
0.029 |
0.031 |
0.008 |
0.003 |
0.003 |
0.014 |
Source: Own elaboration with SABI data.
4.2. Comparative analysis of the economic and financial features between female and male digital startups
Below is a comparison of the economic and financial characteristics of the female companies in relation to their male counterparts.
4.2.1. Comparison of mean equality between startups founded by women and men
Table 2 displays the mean values in the set of female digital companies along with a set of male companies for various economic variables measuring business size, such as the total company assets, the number of employees, and the total annual revenue. The variables were logged to standardise the data.
Table 2. Test of mean equality of companies led by men and women.
|
Men |
Women |
Difference |
t-test |
p-value
|
|||
|
Assets (log) |
Year 0 |
3.947 |
3.715 |
-0.232 |
2.47 |
0.014 |
** |
|
Year 1 |
4.650 |
4.513 |
-0.137 |
1.43 |
0.155 |
|
|
|
Year 2 |
4.905 |
4.858 |
-0.048 |
0.55 |
0.584 |
|
|
|
Year 3 |
5.168 |
5.111 |
-0.057 |
0.63 |
0.53 |
|
|
|
Year 4 |
5.244 |
5.205 |
-0.039 |
0.44 |
0.661 |
|
|
|
Year 5 |
5.328 |
5.344 |
0.016 |
-0.18 |
0.855 |
|
|
|
Employees (log) |
Year 0 |
0.404 |
0.235 |
-0.170 |
5.29 |
0.000 |
*** |
|
Year 1 |
0.847 |
0.648 |
-0.199 |
4.87 |
0.000 |
*** |
|
|
Year 2 |
0.955 |
0.826 |
-0.128 |
2.73 |
0.007 |
*** |
|
|
Year 3 |
1.186 |
1.051 |
-0.135 |
2.87 |
0.005 |
*** |
|
|
Year 4 |
1.220 |
1.088 |
-0.132 |
2.61 |
0.010 |
** |
|
|
Year 5 |
1.218 |
1.080 |
-0.138 |
2.75 |
0.007 |
*** |
|
|
Revenue (log) |
Year 0 |
3.987 |
3.303 |
-0.684 |
6.55 |
0.000 |
*** |
|
Year 1 |
5.063 |
4.275 |
-0.788 |
6.43 |
0.000 |
*** |
|
|
Year 2 |
5.317 |
4.650 |
-0.667 |
5.87 |
0.000 |
*** |
|
|
Year 3 |
5.495 |
4.963 |
-0.532 |
5.38 |
0.000 |
*** |
|
|
Year 4 |
5.589 |
5.154 |
-0.436 |
5.00 |
0.000 |
*** |
|
|
Year 5 |
5.655 |
5.336 |
-0.319 |
3.85 |
0.000 |
*** |
|
Source: Own elaboration with SABI data.
Graph 1. Difference in size between companies led by men and women.
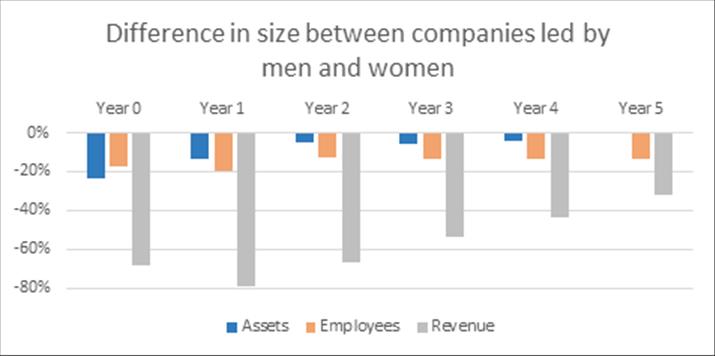
Source: Own elaboration with SABI data.
In Graph 1, it can be observed that companies led by women are smaller than those led by men. These differences are more pronounced in the early years of the companies' lives and generally tend to decrease over time. The variable showing the largest difference is the total annual revenue, which exceeds 60% in the first three years of the company's life. The number of employees fluctuates between a 10% and 20% difference between companies, and the total assets in the founding year are 20% higher in male-led companies, although this difference diminishes and disappears in the fifth year of operation.
4.2.2. Comparison of profitability
Before matching companies using PSM, we can observe that companies founded by women achieve lower profitability compared to those founded by men, especially in the first three years since the company's establishment (Table 2). However, once we compare companies of the same size between men and women and eliminate sample selection biases using PSM, these differences diminish or disappear. This fact indicates that the smaller size of women's companies is what might be preventing them from achieving the "economies" (of scale, scope, network, etc.) that would allow them to be more profitable. We proceed to analyse this situation.
As shown in Table 3 concerning the ROA, female startups exhibit an ROA close to that of male companies in the early years when controlling for company size, although, overall, there is a deterioration in the value of the ROA of female startups over time. Additionally, examining the data reflected in Table 4, if we consider a company profitable when its ROA exceeds 5%, female startups do not reach this level of profitability in any period, while male startups do achieve it in the later years when controlling the sample for size.
Graph 2. Difference in ROA between male and female companies
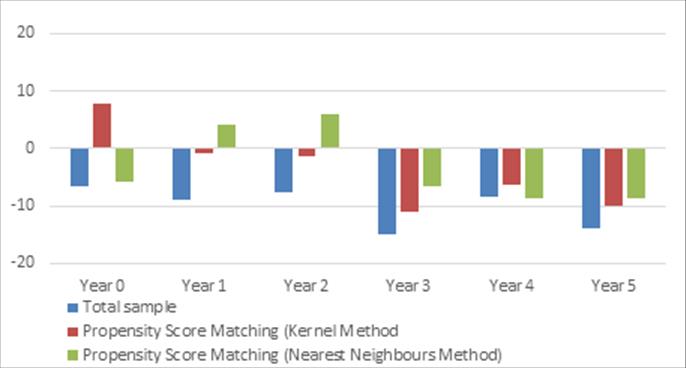
Source: Own elaboration with SABI data.
Regarding financial profitability (ROE), when controlling for size, we observe a better result for ROE in the early years of the company's life. However, this ratio experiences a negative trend in female startups compared to male ones, although in this case, the differences diminish over time in the matchings conducted (Graph 3).
Graph 3. Difference of ROE between male-led and female-led companies
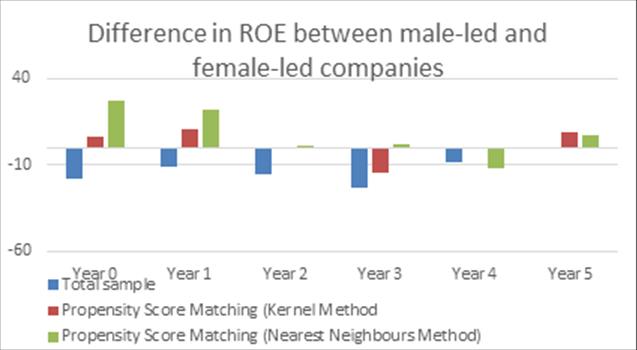
Source: Own elaboration with SABI data.
The analysis of both ratios collectively by periods will provide us with information on the "leverage effect." As shown in the tables, in the case of the sample of male and female startups controlled by size, the ROA is generally lower than the ROE in each year analysed, implying a positive leverage effect. This means that part of the assets has been financed with debt, leading to an increase in financial profitability.
Overall, the assets of female-led companies initially demonstrate a similar ability to generate profits (ROA) compared to male-led startups, although this situation tends to worsen over time. They also achieve better returns on invested funds (ROE) at the beginning of their operations, although this tendency diminishes as the company matures.
Table 3. PSM result in the profitability indicators.
|
Complete Sample |
Propensity Score Matching (Kernel Method) |
Propensity Score Matching (Nearest Neighbour Method) |
||||||||||||||||
|
Men |
Women |
Difference |
t-test |
p-value |
Men |
Women |
Difference |
t-test |
p-value |
Men |
Women |
Difference |
t-test |
p-value |
||||
|
ROA |
Year 0 |
-1.52 |
-8.15 |
-6.63 |
1.13 |
0.265 |
|
-6.79 |
1.12 |
7.91 |
0.953 |
0.341 |
|
6.94 |
1.12 |
-5.81 |
-0.40 |
0.692 |
|
Year 1 |
5.35 |
-3.66 |
-9.01 |
1.75 |
0.086 |
* |
0.08 |
-0.84 |
-0.92 |
-0.169 |
0.866 |
|
-4.91 |
-0.84 |
4.07 |
0.47 |
0.636 |
|
|
Year 2 |
5.01 |
-2.57 |
-7.58 |
1.75 |
0.086 |
* |
1.17 |
-0.14 |
-1.31 |
-0.247 |
0.805 |
|
-6.22 |
-0.14 |
6.09 |
0.94 |
0.350 |
|
|
Year 3 |
8.25 |
-6.76 |
-15.01 |
3.41 |
0.001 |
*** |
3.71 |
-7.35 |
-11.06 |
-2.463 |
0.014 |
** |
-0.67 |
-7.35 |
-6.67 |
-1.23 |
0.217 |
|
|
Year 4 |
7.16 |
-1.29 |
-8.44 |
1.61 |
0.114 |
|
4.98 |
-1.29 |
-6.27 |
-1.216 |
0.224 |
|
7.48 |
-1.29 |
-8.77 |
-1.633 |
0.102 |
|
|
Year 5 |
7.55 |
-6.45 |
-14.00 |
2.36 |
0.026 |
** |
4.81 |
-5.24 |
-10.05 |
-1.787 |
0.074 |
* |
3.45 |
-5.24 |
-8.69 |
-1.125 |
0.261 |
|
|
ROE |
Year 0 |
14.74 |
-3.18 |
-17.92 |
2.28 |
0.030 |
** |
7.98 |
14.28 |
6.30 |
0.466 |
0.641 |
|
-12.69 |
14.28 |
26.97 |
1.62 |
0.105 |
|
Year 1 |
27.29 |
15.82 |
-11.47 |
1.36 |
0.183 |
|
12.58 |
23.25 |
10.67 |
1.261 |
0.207 |
|
1.66 |
23.25 |
21.60 |
1.47 |
0.141 |
|
|
Year 2 |
27.30 |
11.59 |
-15.71 |
2.27 |
0.027 |
** |
17.44 |
16.73 |
-0.72 |
-0.059 |
0.953 |
|
16.46 |
16.73 |
0.27 |
0.02 |
0.982 |
|
|
Year 3 |
23.42 |
-0.23 |
-23.65 |
2.73 |
0.010 |
** |
13.58 |
-0.75 |
-14.32 |
-1.691 |
0.091 |
* |
11.28 |
12.83 |
1.55 |
0.10 |
0.920 |
|
|
Year 4 |
20.14 |
11.34 |
-8.80 |
1.26 |
0.219 |
|
12.36 |
11.34 |
-1.03 |
-0.133 |
0.894 |
|
11.38 |
-0.75 |
-12.13 |
-1.12 |
0.264 |
|
|
Year 5 |
19.24 |
18.21 |
-1.02 |
0.05 |
0.961 |
|
8.58 |
17.10 |
8.52 |
0.656 |
0.512 |
|
9.99 |
17.10 |
7.11 |
0.40 |
0.691 |
|
|
|
|
|
|
|
|
|
|
|
|
|
|
|
|
|
|
|
|
|
Source: Own elaboration with SABI data.
4.2.3. Leverage comparison
Regarding leverage, it has been observed that women-led companies are initially less indebted, less leveraged, and more solvent. When matching similar male-led companies using PSM, although the differences are reduced, they do not disappear completely, especially in relation to solvency (they remain more solvent) and indebtedness, particularly in the first three years.
As seen in Graph 4, female-led startups generally exhibit a lower level of indebtedness and a more stable trend compared to male-led ones, which become more indebted in the two periods following the establishment of the company. Meanwhile, female-led startups, in general, reduce this ratio and fluctuate to a lesser extent as the periods progress.
Graph 4. Debt difference between male-led and female-led companies
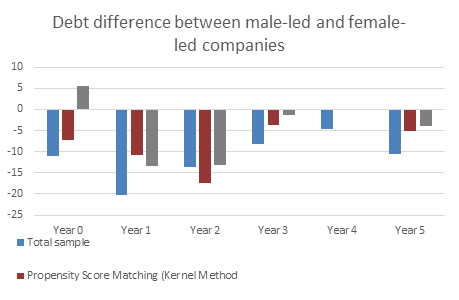
Source: Own elaboration with SABI data.
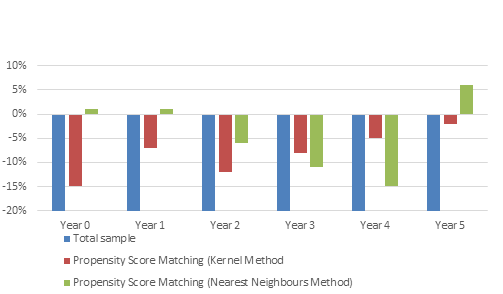
Regarding the leverage ratio, and in line with the variables of debt level and equity level, we observe that female-led startups are much less leveraged than their male counterparts. These differences are notable in years 2, 3, and 4 of the sample, as a result of an increase in leverage for male-led startups that is greater than that for female-led ones (Graph 5).
Graph 5. Difference in the level of financial leverage between male-led and female-led companies
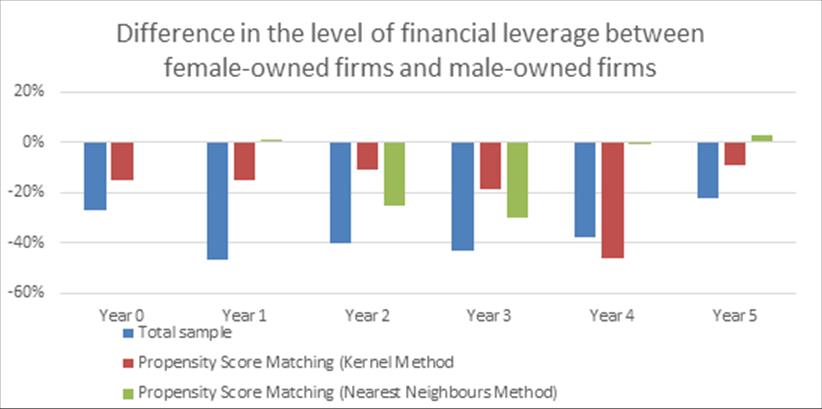
Source: Own elaboration with SABI data.
Regarding the level of equity, Table 4 shows that female-led startups exhibit higher equity levels compared to male-led ones, and this difference increases over time, with significant values of around 100% in the third and fifth years of analysis, according to the nearest neighbour method. This finding may indicate the capacity of female-led startups to attract investors, particularly considering the unique financing characteristics these startups possess. Table 5 also presents the solvency ratio, which demonstrates the favourable solvency position of female-led startups, as they show better results than their male-led counterparts in most of the values when both analysing the complete sample and controlling for size.
Table 4. Result of PSM on the leverage indicators
|
Complete Sample |
Propensity Score Matching (Kernel Method) |
Propensity Score Matching (Nearest Neighbour Method) |
|||||||||||||||||
|
Men |
Women |
Difference |
t-test |
p-value |
Men |
Women |
Difference |
t-test |
p-value |
Men |
Women |
Difference |
t-test |
p-value |
|||||
|
Debt ratio |
Year 0 |
59.87 |
48.84 |
-11.04 |
2.03 |
0.048 |
** |
62.47 |
55.20 |
-7.27 |
-0.98 |
0.327 |
49.65 |
55.20 |
5.55 |
0.50 |
0.618 |
|
|
|
Year 1 |
65.96 |
45.68 |
-20.28 |
4.64 |
0.000 |
*** |
60.94 |
50.28 |
-10.66 |
-1.93 |
0.054 |
* |
63.73 |
50.28 |
-13.45 |
-1.71 |
0.087 |
* |
|
|
Year 2 |
63.76 |
50.21 |
-13.55 |
3.36 |
0.001 |
** |
67.49 |
49.99 |
-17.49 |
-3.37 |
0.001 |
*** |
63.16 |
49.99 |
-13.16 |
-1.55 |
0.120 |
|
|
|
Year 3 |
61.73 |
53.56 |
-8.17 |
1.69 |
0.092 |
* |
56.71 |
52.95 |
-3.76 |
-0.60 |
0.551 |
52.95 |
51.74 |
-1.21 |
0.13 |
0.897 |
|
||
|
Year 4 |
59.09 |
54.51 |
-4.58 |
0.83 |
0.405 |
|
54.59 |
54.51 |
-0.08 |
-0.01 |
0.991 |
54.69 |
54.51 |
-0.18 |
-0.02 |
0.982 |
|
||
|
Year 5 |
59.66 |
49.14 |
-10.52 |
1.53 |
0.125 |
|
54.23 |
49.14 |
-5.09 |
-0.51 |
0.607 |
53.02 |
49.14 |
-3.87 |
-0.37 |
0.712 |
|
||
|
Equity |
Year 0 |
2.58 |
2.46 |
-0.12 |
0.43 |
0.670 |
2.80 |
2.84 |
0.03 |
0.08 |
0.935 |
|
2.71 |
2.84 |
0.13 |
0.237 |
0.813 |
|
|
|
Year 1 |
3.12 |
3.36 |
0.24 |
-0.83 |
0.411 |
3.28 |
3.48 |
0.20 |
0.65 |
0.515 |
|
3.33 |
3.48 |
0.14 |
0.272 |
0.786 |
|
||
|
Year 2 |
3.45 |
3.92 |
0.48 |
-2.27 |
0.027 |
** |
3.44 |
3.98 |
0.54 |
2.63 |
0.009 |
*** |
3.05 |
3.98 |
0.93 |
1.869 |
0.062 |
* |
|
|
Year 3 |
3.65 |
3.83 |
0.18 |
-0.62 |
0.539 |
3.66 |
3.96 |
0.29 |
1.18 |
0.237 |
|
4.24 |
3.96 |
-0.29 |
-0.7 |
0.485 |
|
||
|
Year 4 |
3.84 |
3.99 |
0.16 |
-0.48 |
0.637 |
3.80 |
3.99 |
0.20 |
0.60 |
0.549 |
|
3.99 |
4.04 |
0.05 |
-0.16 |
0.873 |
|
||
|
Year 5 |
3.96 |
4.61 |
0.65 |
1.45 |
0.163 |
3.99 |
4.61 |
0.61 |
1.19 |
0.234 |
|
3.57 |
4.61 |
1.04 |
2.075 |
0.038 |
** |
||
|
Financial leverage |
Year 0 |
0.35 |
0.08 |
-0.27 |
3.60 |
0.000 |
*** |
0.16 |
0.01 |
-0.15 |
-1.91 |
0.056 |
* |
0.01 |
0.01 |
0.00 |
0.11 |
0.916 |
|
|
Year 1 |
0.66 |
0.19 |
-0.47 |
2.72 |
0.006 |
*** |
0.25 |
0.10 |
-0.15 |
-1.57 |
0.117 |
0.09 |
0.10 |
0.01 |
0.12 |
0.907 |
|
||
|
Year 2 |
0.48 |
0.08 |
-0.40 |
1.65 |
0.099 |
* |
0.31 |
0.21 |
-0.11 |
-0.73 |
0.464 |
0.50 |
0.25 |
-0.25 |
-0.65 |
0.517 |
|
||
|
Year 3 |
0.49 |
0.05 |
-0.43 |
2.90 |
0.004 |
*** |
0.27 |
0.09 |
-0.19 |
-1.45 |
0.147 |
0.39 |
0.09 |
-0.30 |
-0.72 |
0.473 |
|
||
|
Year 4 |
0.41 |
0.04 |
-0.38 |
3.05 |
0.002 |
*** |
0.52 |
0.05 |
-0.46 |
-1.11 |
0.266 |
0.06 |
0.05 |
-0.01 |
-0.13 |
0.893 |
|
||
|
Year 5 |
0.26 |
0.04 |
-0.22 |
3.78 |
0.000 |
*** |
0.13 |
0.04 |
-0.09 |
-1.49 |
0.137 |
0.01 |
0.04 |
0.03 |
1.19 |
0.232 |
|
||
|
Solvency (log) |
Year 0 |
0.21 |
0.76 |
0.55 |
-2.14 |
0.037 |
** |
0.14 |
0.58 |
0.43 |
2.00 |
0.046 |
** |
0.32 |
0.58 |
0.26 |
0.42 |
0.676 |
|
|
Year 1 |
0.15 |
0.82 |
0.67 |
-3.45 |
0.001 |
*** |
0.29 |
0.73 |
0.45 |
3.02 |
0.003 |
*** |
0.42 |
0.73 |
0.32 |
0.74 |
0.462 |
|
|
|
Year 2 |
0.17 |
0.52 |
0.35 |
-2.14 |
0.036 |
** |
0.17 |
0.55 |
0.38 |
1.99 |
0.046 |
** |
-0.05 |
0.55 |
0.60 |
1.93 |
0.053 |
* |
|
|
Year 3 |
0.24 |
0.58 |
0.34 |
-1.76 |
0.084 |
* |
0.33 |
0.49 |
0.17 |
0.82 |
0.413 |
|
0.55 |
0.49 |
-0.06 |
-0.15 |
0.881 |
|
|
|
Year 4 |
0.33 |
0.39 |
0.06 |
-0.25 |
0.801 |
|
0.54 |
0.39 |
-0.16 |
-0.38 |
0.706 |
|
0.78 |
0.39 |
-0.39 |
-1.28 |
0.199 |
|
|
|
Year 5 |
0.31 |
0.79 |
0.47 |
-1.91 |
0.067 |
* |
0.46 |
0.74 |
0.27 |
0.70 |
0.486 |
|
-0.24 |
0.74 |
0.98 |
3.36 |
0.001 |
*** |
|
Source: Own elaboration with SABI data.
4.2.4. Comparison of financial efficiency
The same argument as above could be used for operational efficiency. Without matching, women-led companies are less efficient, but once matched using PSM with male-led companies of similar characteristics, there are no appreciable differences in the productivity generated per employee (Graph 6).
Graph 6. Difference in the level of revenue per employee between companies led by men and women
Source: Own elaboration with SABI data.
Regarding the effective interest paid by companies to obtain financing, in the case of female startups, this interest is higher in both the unmatched sample and the matched sample (Table 5). However, concerning the interest-to-revenue ratio, the differences are small in both samples.
Table 5. Result of PSM on the financial efficiency indicators
|
Complete Sample |
Propensity Score Matching (Kernel Method) |
Propensity Score Matching (Nearest Neighbour Method) |
|||||||||||||||||
|
|
|
|
|
|
|||||||||||||||
|
Men |
Women |
Difference |
t-test |
p-value |
Men |
Women |
Difference |
t-test |
p-value |
Men |
Women |
Difference |
t-test |
p-value |
|||||
|
Revenue per employee |
Year 0 |
3.67 |
3.09 |
-0.58 |
5.26 |
0.000 |
*** |
3.66 |
3.50 |
-0.15 |
-1.67 |
0.095 |
* |
3.52 |
3.53 |
0.01 |
-0.12 |
0.906 |
|
|
Year 1 |
4.28 |
3.72 |
-0.56 |
5.27 |
0.000 |
*** |
3.93 |
3.86 |
-0.07 |
-0.70 |
0.484 |
|
3.86 |
3.86 |
0.01 |
0.06 |
0.952 |
|
|
|
Year 2 |
4.39 |
3.91 |
-0.48 |
4.86 |
0.000 |
*** |
4.13 |
4.01 |
-0.12 |
-0.94 |
0.349 |
|
4.07 |
4.01 |
-0.06 |
-0.53 |
0.596 |
|
|
|
Year 3 |
4.33 |
3.95 |
-0.38 |
4.96 |
0.000 |
*** |
4.08 |
4.00 |
-0.08 |
-1.17 |
0.240 |
|
4.11 |
4.00 |
-0.11 |
-1.36 |
0.175 |
|
|
|
Year 4 |
4.40 |
4.09 |
-0.31 |
4.91 |
0.000 |
*** |
4.15 |
4.10 |
-0.05 |
-0.84 |
0.401 |
|
4.25 |
4.10 |
-0.15 |
-1.47 |
0.143 |
|
|
|
Year 5 |
4.47 |
4.24 |
-0.24 |
3.32 |
0.001 |
*** |
4.33 |
4.31 |
-0.02 |
-0.34 |
0.734 |
|
4.25 |
4.31 |
0.06 |
1.01 |
0.311 |
|
|
|
Effective interest rate |
Year 0 |
0.18 |
0.28 |
0.10 |
-0.47 |
0.650 |
0.12 |
0.37 |
0.25 |
1.03 |
0.303 |
|
0.02 |
0.37 |
0.36 |
1.32 |
0.186 |
|
|
|
Year 1 |
0.57 |
8.06 |
7.49 |
-1.98 |
0.070 |
* |
0.29 |
9.39 |
9.10 |
1.74 |
0.083 |
* |
0.13 |
9.39 |
9.26 |
2.148 |
0.032 |
** |
|
|
Year 2 |
0.74 |
0.65 |
-0.09 |
0.20 |
0.841 |
0.65 |
0.97 |
0.32 |
-0.24 |
0.811 |
|
0.90 |
0.65 |
-0.25 |
-0.13 |
0.897 |
|
||
|
Year 3 |
0.65 |
0.92 |
0.27 |
-0.34 |
0.737 |
0.75 |
0.92 |
0.17 |
0.21 |
0.838 |
|
0.11 |
0.92 |
0.81 |
1.106 |
0.269 |
|
||
|
Year 4 |
1.25 |
2.89 |
1.64 |
-1.02 |
0.330 |
1.38 |
2.89 |
1.51 |
1.09 |
0.275 |
|
0.31 |
2.89 |
2.58 |
1.488 |
0.137 |
|
||
|
Year 5 |
0.85 |
2.84 |
2.00 |
-1.05 |
0.316 |
0.27 |
3.13 |
2.86 |
1.45 |
0.148 |
|
0.04 |
3.13 |
3.08 |
1.508 |
0.132 |
|
||
|
Interest to revenue |
Year 0 |
0.0015 |
0.0124 |
0.01 |
-1.447 |
0.15 |
|
0.001 |
0.012 |
0.010 |
1.03 |
0.305 |
|
0.0001 |
0.0116 |
0.011 |
1.121 |
0.262 |
|
|
Year 1 |
0.0104 |
0.0293 |
0.02 |
-1.431 |
0.154 |
|
0.018 |
0.032 |
0.014 |
1.01 |
0.313 |
|
0.0030 |
0.0320 |
0.029 |
2.204 |
0.028 |
** |
|
|
Year 2 |
0.0135 |
0.0315 |
0.02 |
-1.318 |
0.189 |
|
0.011 |
0.027 |
0.02 |
1.24 |
0.216 |
|
0.0215 |
0.0271 |
0.006 |
0.361 |
0.718 |
|
|
|
Year 3 |
0.0047 |
0.0077 |
0.00 |
-0.797 |
0.427 |
|
0.007 |
0.008 |
0.00 |
0.35 |
0.726 |
|
0.0051 |
0.0080 |
0.003 |
0.725 |
0.468 |
|
|
|
Year 4 |
0.0036 |
0.0029 |
0.00 |
0.049 |
0.626 |
|
0.007 |
0.003 |
0.00 |
-1.11 |
0.267 |
|
0.0030 |
0.0077 |
0.005 |
-3.07 |
0.002 |
*** |
|
|
Year 5 |
0.0026 |
0.065 |
0.06 |
-0.999 |
0.32 |
|
0.002 |
0.003 |
0.00 |
0.59 |
0.553 |
|
0.0022 |
0.0026 |
0.000 |
0.246 |
0.806 |
|
|
Source: Own elaboration with SABI data.
This article has analysed gender-based differences in the economic and financial performance of digital startups in Spain. The results highlight structural inequalities that limit the growth and competitiveness of female-led ventures, particularly in their early stages. Despite these constraints, it is observed that when firms are compared under equivalent conditions—using Propensity Score Matching (PSM)—female-led startups achieve similar levels of profitability and operational efficiency as those led by men.
One of the main findings is that the initial smaller size of female-led firms plays a decisive role in their performance gaps. These enterprises tend to operate with fewer resources, have lower access to financing, and face greater difficulties in reaching the thresholds necessary to benefit from economies of scale and scope. This dynamic helps explain their lower levels of leverage and debt, as well as the higher interest rates they face, even when structural variables are controlled. The persistence of such disadvantages suggests the presence of implicit gender-based biases in the financing ecosystem.
These results also shed light on broader discussions regarding financial behaviour, risk perception, and indebtedness in female entrepreneurship. Women-led firms often adopt more conservative financial structures, characterised by lower debt levels and greater solvency. However, these decisions cannot simply be interpreted as higher aversion to risk. Instead, they appear to reflect a rational adaptation to an environment in which access to credit is more limited, financing conditions are less favourable, and the cost of potential failure is higher. In this context, the prioritisation of internal funding, the preference for gradual growth, and the cautious use of debt emerge as strategies that aim to ensure stability and reduce vulnerability during the early stages of business development.
The analysis also shows that when the structural disadvantages faced by female-led firms are accounted for, the supposed performance gap largely disappears. Once comparable groups of firms are analysed, women-led startups show levels of profitability (ROA and ROE) close to those of male-led startups. This indicates that observed differences are not the result of managerial ability or entrepreneurial capacity, but of unequal initial conditions. The deterioration of profitability indicators over time among female-led firms further suggests that the persistence of structural constraints may prevent these ventures from capturing growth opportunities associated with scale, investment, or rapid expansion.
The dynamics of risk and indebtedness observed in this study also relate to their implications for scalability in digital sectors. Digital businesses often require significant upfront investment and rapid market positioning, two conditions that may disadvantage firms that rely on more conservative financial strategies or have less access to external capital. Nevertheless, the stability and solvency displayed by women-led startups may also indicate greater resilience, even if this entails slower short-term growth.
Furthermore, the results support the importance of fostering gender diversity not only among entrepreneurial teams but also within corporate governance structures, where its positive influence on business performance has been demonstrated in other contexts such as the European insurance sector (Morales de Vega et al., 2025). Encouraging gender-balanced leadership structures can contribute to more robust decision-making processes and facilitate the consolidation of women-led digital ventures.
These findings underscore the need for public policies that explicitly address gender gaps in entrepreneurship, particularly in digital sectors. Ensuring equitable access to financing, improving credit evaluation processes, and expanding support services for early-stage ventures are essential steps to enhance the long-term sustainability and competitiveness of women-led startups. Existing programmes play a relevant role, but their scope and coordination should be strengthened to address structural disparities more effectively.
Future research could complement this quantitative analysis with qualitative approaches that capture the perceptions, motivations, and strategies of entrepreneurs. Understanding how women and men experience and navigate digital entrepreneurship would provide additional insights into the mechanisms underpinning gendered differences in financial behaviour and business performance.
Other lines of action should consider the importance of mentorship, networks, and role models in strengthening the visibility and legitimacy of women in digital entrepreneurship. Access to investment networks, accelerators, and incubators remains uneven, reinforcing informal barriers that limit women’s growth potential. Promoting collaborative spaces, peer learning, and intergenerational support structures may thus become key drivers of empowerment and sustainability.
Finally, the role of intersectionality must be acknowledged. Gender interacts with factors such as age, socio-economic background, or territorial context, shaping differentiated entrepreneurial realities. Policies aimed at fostering equality should therefore incorporate these dimensions, ensuring that support programmes respond to the diverse needs and constraints experienced by different groups of women entrepreneurs in the digital economy.
The authors declare that they have no direct or indirect conflict of interest with the editors, members of the editorial team, or members of the scientific committee.
Manuel M. Molina López: conceptualization, formal analysis, research, methodology, project management, writing. Ricardo J. Palomo Zurdo and Susana González-Pérez: supervision, validation, writing. Encina Morales de Vega: supervision, validation, writing. All authors: data curation, writing, visualization.
The data supporting the findings of this study are publicly available at SABI database.
During the preparation of this work, the authors used Chat GPT 5.2 for the purpose of translating the manuscript. After using this tool, the authors reviewed and edited the content as necessary, assuming full responsibility for the content of the publication.
This research was funded by the project “PID2020-114183RB-I00” and “Chair Universidad CEU San Pablo- MOEVE Digital.”
Agrawal, R., P. Bakhshi, A. Chandani, R. Birau, and S. Mendon (2023). Challenges faced by women entrepreneurs in South Asian countries using interpretive structural modeling. Cogent Business & Management, 10(2), 2244755. https://doi.org/10.1080/23311975.2023.2244755.
Ahl, H. (2006). Why research on women entrepreneurs needs new directions. Entrepreneurship Theory and Practice 30, 595–621. https://doi.org/10.1111/j.1540-6520.2006.00138.x.
Ahl, H. and S. Marlow (2012). Exploring the dynamics of gender, feminism and entrepreneurship: Advancing debate to escape a dead end?. Organization, 19, 543–62. https://doi.org/10.1177/1350508412448695.
Aidis, R. and J. Weeks (2016). Mapping the gendered ecosystem: The evolution of measurement tools for comparative high-impact female entrepreneur development. International Journal of Gender and Entrepreneurship 8, 330–52. https://doi.org/10.1108/IJGE-12-2015-0044.
Alhajri, A., and M. Aloud (2024). Female digital entrepreneurship: a structured literature review. International Journal of Entrepreneurial Behavior & Research, 30(2/3), 369-397. https://doi.org/10.1108/IJEBR-09-2022-0790.
Alquézar Crusellas, R. (2025). Conflicto, democratización de las aplicaciones tecnológicas y control del algoritmo. Prácticas transformadoras en el cooperativismo de plataforma. REVESCO. Revista de Estudios Cooperativos, 149(1), 1-13, e99740. https://dx.doi.org/10.5209/REVE.99740.
Almus, M. and E.A. Nerlinger (1999). Growth of new technology-based firms: which factors matter? Small Business Economics 13, 141–54. https://doi.org/10.1023/A:1008138709724.
Blanchflower, D. G., A. Oswald, and A. Stutzer (2001). Latent entrepreneurship across nations. European Economic Review 45, 680–91.
Brixiová, Z. and T. Kangoye (2016). Gender and constraints to entrepreneurship in Africa: New evidence from Swaziland. Journal of Business Venturing Insights 5 1–8.
Dana, L. P., E. Crocco, F. Culasso and E. Giacosa (2024). Mapping the field of digital entrepreneurship: a topic modeling approach. International Entrepreneurship and Management Journal, 20(2), 1011-1045. https://doi.org/10.1007/s11365-023-00926-6.
Del Cerro Martínez, M.; Palomo Zurdo, R. & Molina López, M. (2023). Propuesta de un modelo de Integración Generacional en los procesos de Transformación Digital: Un reto estratégico para una economía digital socialmente inclusiva. REVESCO. Revista de Estudios Cooperativos, 1(145), e92556. https://dx.doi.org/10.5209/reve.92556.
Demartini, P. (2018). Innovative female-led startups. Do women in business underperform?. Administrative Sciences 8(4), p. 70. https://doi.org/10.3390/admsci8040070.
DIRCE (2023). Available online https://www.ine.es/dyngs/INEbase/es/categoria.htm?c=Estadistica_P&cid=1254735576550 (accessed on 10 October 2023).
Du Rietz, A. and M. Henrekson (2000). Testing the female underperformance hypothesis. Small Business Economics 14, 1–10. https://doi.org/10.1023/A:1008106215480.
Elia, G., L. Gatti and A. Margherita (2020). The genome of digital entrepreneurship: A descriptive framework. Innovative Entrepreneurship in Action: From High-Tech to Digital Entrepreneurship, 7-26. https://doi.org/10.1007/978-3-030-42538-8_2.
European Comission (2023). Digital Economy and Society Index (DESI) 2022. Available at: https://digital-strategy.ec.europa.eu/es/policies/desi (Accessed on 5 May 2023).
Fairlie, R. W. and A. Robb (2007). Families, human capital, and small business: Evidence from the characteristics of business owners survey. ILR Review 60, 225–45. https://doi.org/10.1177/001979390706000204.
Farhat, J., and N. Mijid (2016). Do women lag behind men? A matched-sample analysis of the dynamics of gender gaps. Journal of Economics and Finance, 42(4), 682-709. https://doi.org/10.1007/s12197-017-9416-8.
Fernández Torres, Y.; Palomo Zurdo, R. & Gutiérrez Fernández, M. (2025). Transformación Digital y accesibilidad en la Banca Cooperativa Española: un estudio del desempeño de sus páginas Webs. REVESCO. Revista de Estudios Cooperativos, 150(1), 1-20, e103422. https://dx.doi.org/10.5209/REVE.103422.
GEDI (2018). Available online: http://thegedi.org/research/womens-entrepreneurship-index/ (accessed on 10 October 2023).
Global Entrepreneurship Monitor (GEM) (2022). Informe GEM España 2022-2023, available at https://www.gem-spain.com/wp-content/uploads/2023/05/Informe-GEM-Espana-2022-2023.pdf (accessed on 10 May 2023).
Global Entrepreneurship Research Association (GERA) (2021). Global Entrepreneurship Monitor 2020/2021. Chicago: Global Entrepreneurship Monitor, available at: https://www.gemconsortium.org/file/open?fileId=50691 (accessed on 10 October 2023).
Gobierno de España (2023). Plan España Digital 2025. Available at https://www.lamoncloa.gob.es/presidente/actividades/Documents/2020/230720-EspañaDigital_2025.pdf (accessed on 5 April 2023).
Gonzalez-Perez, S., Mielgo-Álvarez, A. and Molina-López, M. M. (2025). Higher education quality as a driver of entrepreneurship. International Journal of Quality and Service Sciences, 17(5), 20-40. https://doi.org/10.1108/IJQSS-10-2024-0154.
Grootaert, C., and T. Van Bastelaer (2002). Understanding and measuring social capital. World Bank Publications - Books, The World Bank Group, number 14098, April.
Hechavarría, D. M., and A.E. Ingram (2019). Entrepreneurial ecosystem conditions and gendered national-level entrepreneurial activity: a 14-year panel study of GEM. Small Business Economics, 53, 431-458. https://doi.org/10.1007/s11187-018-9994-7.
Hernández Muñoz, V.; Monzón Campos, J.L. & Torres Ortega, J. (2025). Emprendimiento estudiantil tradicional, social y sostenible en el contexto universitario - una revisión sistemática. REVESCO. Revista de Estudios Cooperativos, 151, e104784. https://dx.doi.org/10.5209/REVE.104784.
Huang, Y., J. Zhang, Y. Xu, Y. Yuan, M. Zhang and L. Huang (2025). Digital entrepreneurial ecosystem and female entrepreneurial activity. Humanities and Social Sciences Communications, 12(1), 1-13. https://doi.org/10.1057/s41599-024-04345-y.
Jawad, M., M. Naz, and Z. Maroof (2021). Era of digital revolution: Digital entrepreneurship and digital transformation in emerging economies. Business Strategy & Development, 4(3), 220-228. https://doi.org/10.1002/bsd2.145.
Jennings, J. E., Z. Rahman and D. Dempsey (2023). Challenging what we think we know: Theory and evidence for questioning common beliefs about the gender gap in entrepreneurial confidence. Entrepreneurship Theory and Practice, 47(2), 369-397. https://doi.org/10.1177/10422587221102108.
Justo, R., D.R. DeTienne, and P. Sieger (2015). Failure or voluntary exit? Reassessing the female underperformance hypothesis. Journal of Business Venturing, 30(6), 775-792. https://doi.org/10.1016/j.jbusvent.2015.04.004.
Kalleberg, A. L. and K.T. Leicht (1991). Gender and organizational performance: Determinants of small business survival and success. Academy of Management Journal 34, 136–61.
Kang, H. Y. (2022). Technological engagement of women entrepreneurs on online digital platforms: Evidence from the Apple iOS App Store. Technovation, 114, 102522. https://doi.org/10.1016/j.technovation.2022.102522.
Kariv, D., O. Kaplan, M. Ibanescu, and L. Cisneros (2023). From perceptions to performance to business intentions: what do women and men entrepreneurs really see. International Journal of Entrepreneurship and Small Business, 50(3), 324-354. https://doi.org/10.1504/IJESB.2023.134173.
Klapper, L. F. and S.C. Parker (2010). Gender and the business environment for new firm creation. The World Bank Research Observer 26, 237–57. https://doi.org/10.1093/wbro/lkp032.
Kourilsky, M. L. and W.B. Walstad (1998). Entrepreneurship and female youth: Knowledge, attitudes, gender differences, and educational practices. Journal of Business Venturing 13, 77–88. https://doi.org/10.1016/S0883-9026(97)00032-3.
Martínez, M.I., N. Guilló and R. Santero (2019). The Social Economy within Technology Based Entrepreneurship in Spain. A qualitative approach. CIRIEC-España, Revista de Economía Pública, Social y Cooperativa, 96, 65-90. https://doi.org/10.7203/CIRIEC-E.96.12969.
Maxfield, S., M. Shapiro, V. Gupta and S. Hass (2010). Gender and risk: Women, risk taking and risk aversion. Gender in Management: An International Journal 25, 586–604. https://doi.org/10.1108/17542411011081383.
Mazrekaj, L. (2024). Gender Entrepreneurial Behaviour: A SSLR (Semi-Systematic Literature Review) Approach. The South East European Journal of Economics and Business, 19(1), 77-95. https://doi.org/10.2478/jeb-2024-0006.
Miniesy, R., E. Elshahawy and H. Fakhreldin (2022). Social media's impact on the empowerment of women and youth male entrepreneurs in Egypt. International Journal of Gender and Entrepreneurship, 14(2), 235-262. https://doi.org/10.1108/IJGE-06-2021-0085.
Molina-López, M. M., González-Pérez, S., García-Centeno, M.C. and Martínez-Martínez, M. (2024). Climbing the Ladder: An Authentic Leadership Program Boosting Adolescent Girls’ Potential. SAGE Open, 14(4), 21582440241307697. https://doi.org/10.1177/21582440241307697.
Molina-López, M. M., Tejeiro Koller, M. R., Rubio-Andrés, M. and González-Pérez S. (2021). Never too late to learn: how education helps female entrepreneurs at overcoming barriers in the digital economy. Sustainability 13(19), 1–17. https://doi.org/10.3390/su131911037.
Morales-Alonso, G., I. Pablo-Lerchundi and M. C. Núñez-Del-Río (2016). Entrepreneurial intention of engineering students and associated influence of contextual factors/Intención emprendedora de los estudiantes de ingeniería e influencia de factores contextuales. Revista de Psicología Social, 31(1), 75-108. https://doi.org/10.1080/02134748.2015.1101314.
Morales De Vega, M. E., M.C. García-Centeno and R. Palomo-Zurdo (2025). Innovative governance for the future: Will gender diversity on boards enhance business performance in the European insurance industry?. European Research on Management and Business Economics, 31(2), 100283. https://doi.org/10.1016/j.iedeen.2025.100283.
Motohashi, K. (2005). University-industry collaborations in Japan: The role of new technology-based firms in transforming the National Innovation System. Research Policy 34, 583–94. https://doi.org/10.1016/j.respol.2005.03.001.
Naldi, F., D. Luzi, A. Valente and I.V. Parenti (2005). Scientific and technological performance by gender, in Moed, H.F., Glänzel, W. and Schmoch, U. (Eds.): Handbook of Quantitative Science and Technology Research, 299–314, Springer, Netherlands.
Nambisan, S. (2017). Digital entrepreneurship: Toward a digital technology perspective of entrepreneurship. Entrepreneurship theory and practice, 41(6), 1029-1055. https://doi.org/10.1111/etap.12254.
OECD (2018). Bridging the Digital Gender Divide. Include, Upskill, Innovate. https://www.oecd.org/digital/bridging-the-digital-gender-divide.pdf (Accessed on 15 February 2023).
OEE (2021). Emprendimiento de mujeres en España. Análisis con datos GEM 2020, Ed. Observatorio del Emprendimiento en España, 2021.
ONTIS (2023). Barómetro de emprendimiento en España 2019, España, https://www.ontsi.es/sites/ontsi/files/2019-12/BarometroEmprendimiento_ConceptosIndicadores_diciembre2019.pdf (accessed on 28 May 2023).
Palomo-Zurdo, R. and C. Isabel Dopacio (2022). How can the digitisation vector of recovery funds affect the social economy?, CIRIEC-España, Revista de Economía Pública, Social y Cooperativa, 104, 143-172. https://doi.org/10.7203/CIRIEC-E.104.21497.
Paul, J., I. Alhassan, N. Binsaif, and P. Singh (2023). Digital entrepreneurship research: A systematic review. Journal of Business Research, 156, 113507. https://doi.org/10.1016/j.jbusres.2022.113507.
Robb, A. M. and J. Watson (2012). Gender differences in firm performance: Evidence from new ventures in the United States. Journal of Business Venturing 27, 544–58. https://doi.org/10.1016/j.jbusvent.2011.10.002.
Robb, A. and J. Wolken (2002). Firm, owner, and financing characteristics: Differences between female-and male-owned small businesses. FEDS Working Paper No. 2002-18. Available online: http://dx.doi.org/10.2139/ssrn.306800.
Rosa, P., S. Carter and D. Hamilton (1996). Gender as a determinant of small business performance: Insights from a British study. Small Business Economics 8, 463–78. http://dx.doi.org/10.1007/BF00390031.
Rubio-Andrés, M., del Mar Ramos-González, M., Molina-López, M. M., and Sastre-Castillo, M. Á. (2023). Training higher education students for employability skills: Is it worth it?. Entrepreneurship and Sustainability Issues, 10(4), 390. http://doi.org/10.9770/jesi.2023.10.4(24).
Sánchez Espada J., Martín López S., Bel Durán P. y Lejarriaga Pérez de las Vacas G. (2018). Educación y formación en emprendimiento social: características y creación de valor social sostenible en proyectos de emprendimiento social. REVESCO. Revista de Estudios Cooperativos, 129, 16-38. https://doi.org/10.5209/REVE.62492.
Shinnar, R. S., D.K. Hsu, B.C. Powell and H. Zhou (2018). Entrepreneurial intentions and start-ups: Are women or men more likely to enact their intentions? International Small Business Journal 36, 60–80. https://journals.sagepub.com/doi/10.1177/0266242617704277.
Shukla, A., P. Kushwah, E. Jain and S.K. Sharma (2021). Role of ICT in emancipation of digital entrepreneurship among new generation women. Journal of Enterprising Communities: People and Places in the Global Economy, 15(1), 137-154. https://doi.org/10.1108/JEC-04-2020-0071.
Storey, D. J. and B.S. Tether (1998). New technology-based firms in the European Union: an introduction. Research Policy 9(26), 933–46.
Tejeiro Koller, M.; Molina López, M.M.; García Villalobos, J.C. (2021). Emprendimiento digital femenino para el desarrollo social y económico: características y barreras en España. REVESCO. Revista de Estudios Cooperativos, vol. 138, e75561. https://dx.doi.org/10.5209/reve.75561.
Watson, J. and S. Robinson (2003). Adjusting for risk in comparing the performances of male-and female-controlled SMEs. Journal of Business Venturing 18, 773–88. https://doi.org/10.1016/S0883-9026(02)00128-3.
Zubillaga Rego, A. and C. Peletier Espiga (2018). El clúster digital en Euskadi. Instituto Vasco de Competitividad, 2028, 1-68.